GovCon organizations constantly assess the opportunities in their portfolio throughout their life-cycle. They need to perform routine opportunity assessments to evaluate the progress over time. They also need to see where opportunities are across the full portfolio at any point in time. However, these assessments often are not consistent and it is challenging to get a clear view of where you stand.
A best practice is to use a standard set of opportunity assessment KPI’s. Using a standard set of KPI’s provides consistency and clarity. This focuses attention and effort on activities that drive the KPI’s. This helps drive a consistent result.
In this article, we’ll describe how we do it with the “Progress Pursuit Assessment” feature of WinCenter. We use a set of 9 KPI’s that are commonly used for Federal Government RFP’s. We’ll also show you what it looks like in various “dashboard” displays. As you will see it is really a simple approach. Using this approach in your organization can be quite powerful as it focuses attention on the key elements that drive success.
9 Commonly Used Assessment KPI’s
In WinCenter we use a set of 9 assessment KPI’s (key performance indicators) for our Progress Pursuit Assessment as detailed below. These KPI’s are based upon best practices for Federal Government RFP opportunities. Yours may vary, but, this is a good set to start with.
Opportunity Progress Assessments Over Time
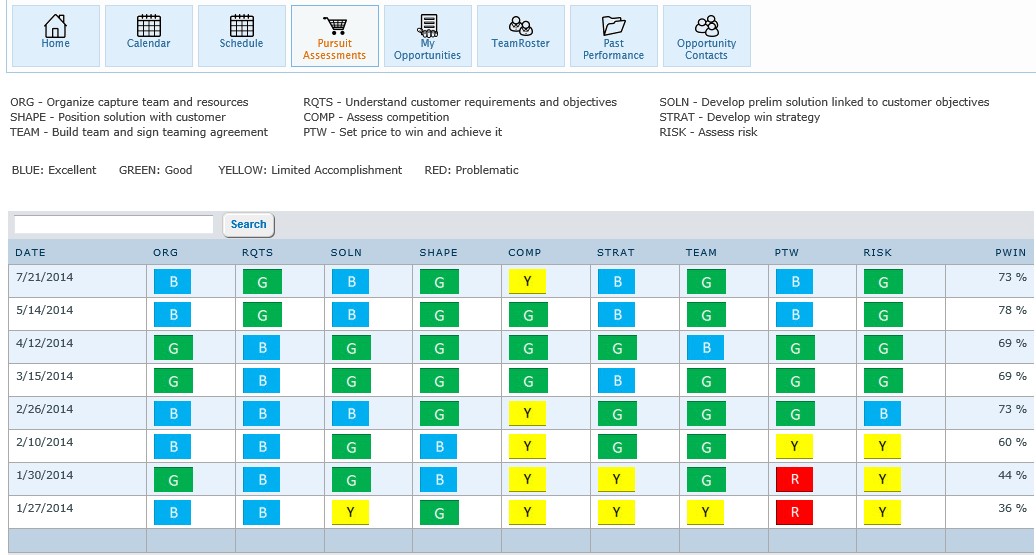
Each opportunity is routinely assessed using these KPI’s throughout its life-cycle. Below is a screenshot of the PPA assessments for a single opportunity over time. The assessments appear in order from oldest at the bottom to newest at the top. There are four KPI color options: Blue, Green, Yellow and Red for each KPI (Blue is Excellent down to Red which Problematic). Thus, with a quick look you can visually see how the opportunity has changed over time (bottom/up).
Note that in the screenshot below we are also using these KPI’s to drive a Probability of Win (Pwin). The calculation is based upon an algorithm that can be adjusted based upon your weighting of each criteria. It becomes interesting to see how the Pwin varies over time.

The Portfolio View
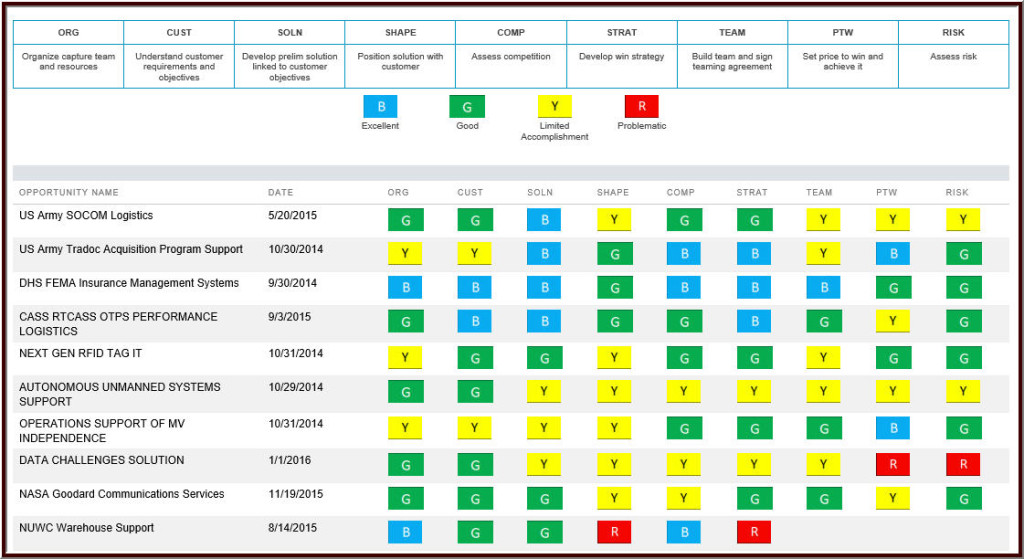
With each opportunity being assessed on a consistent basis you can then roll them up in order to have a top down view of your portfolio. The portfolio view is shown below. It shows the most recent assessment for each opportunity. It makes it very easy to get a quick top down view. You can then drill down into the opportunity to see more details.

Consistency vs. Accuracy
As shown this is a simple approach. The key is the utility of having a consistent set of KPI’s that you can manage to. It is often difficult for GovCon organizations to settle on the KPI’s and apply them. This is primarily because they are seeking accuracy vs. consistency. The purpose of these KPI’s is to take what is a complex process (winning Federal Government RFPs) and distill it down into the key elements that can be focused on and managed to. When you see variances, you can then drill down into the details to drive towards accuracy.
With WinCenter, we accommodate the needs of organizations to use this approach and apply it differently. You can vary the details such as what the KPI’s are, how they are displayed, color options, look and feel, and, calculations such as Pwin. The key is that you establish your set of KPI’s to start with.
For more information on WinCenter for capture and proposal management see the WinCenter product micro-site.


